 frameprobe
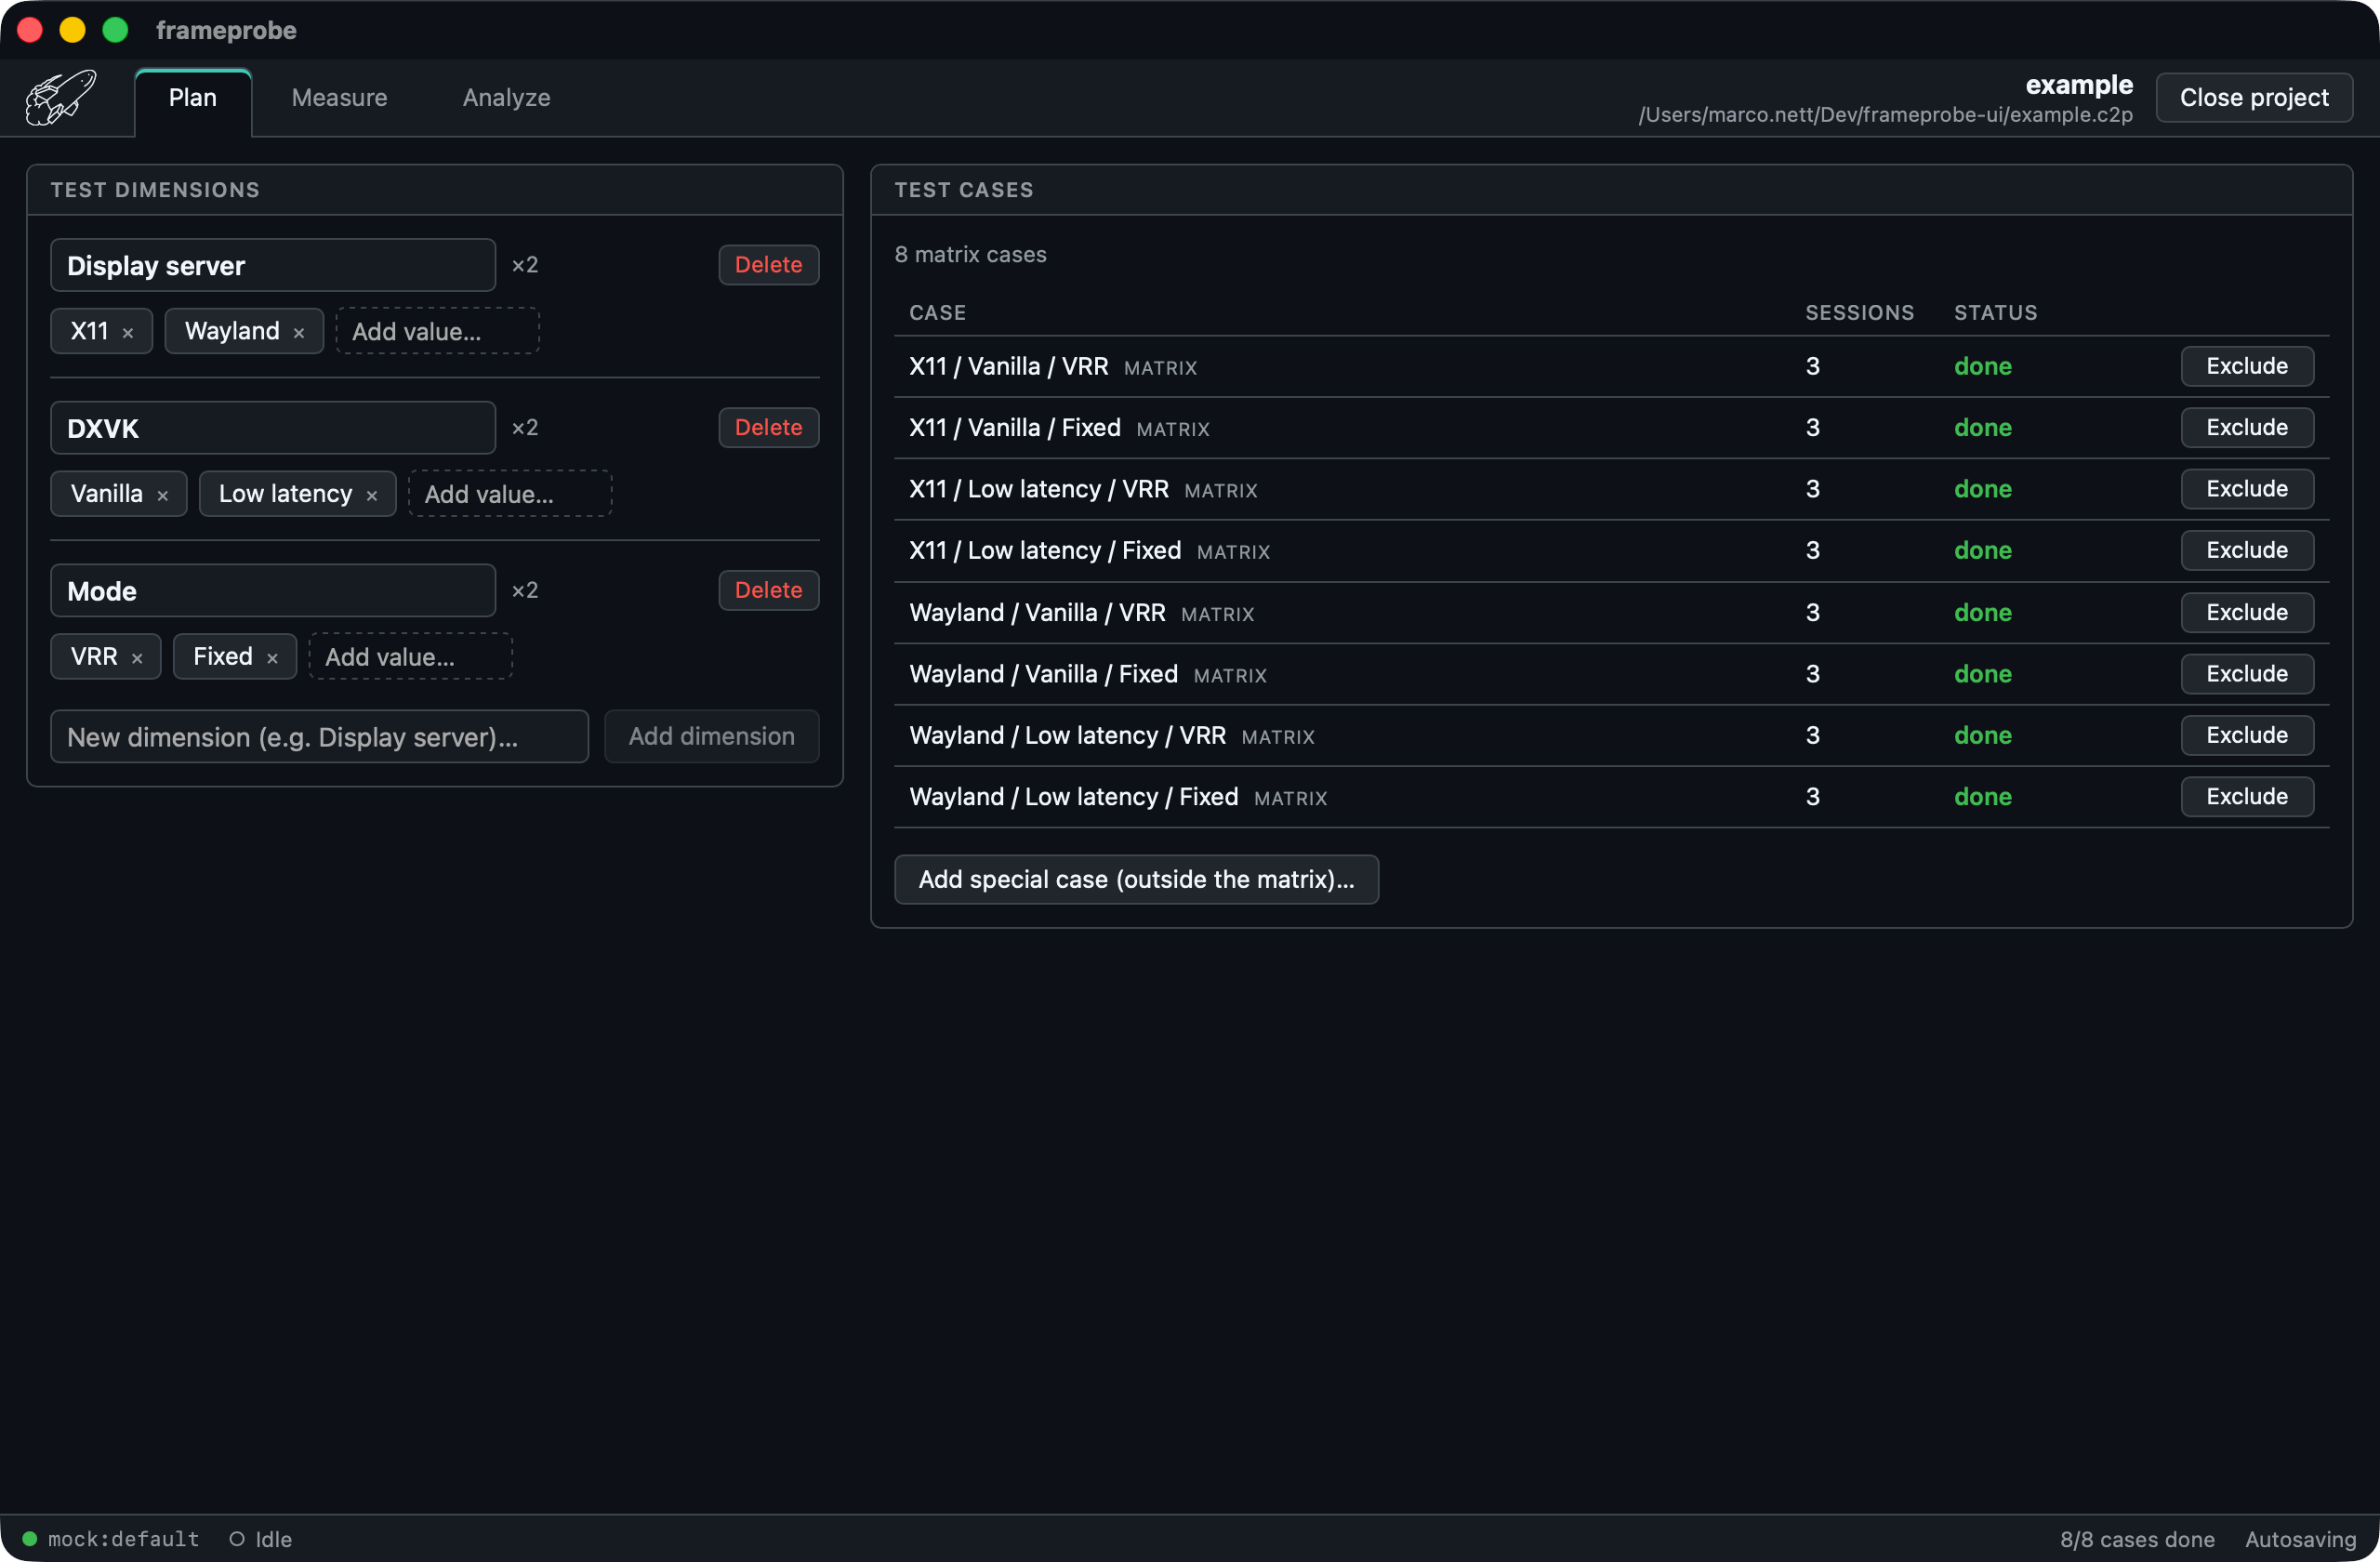
01 / Plan
Define your test cases
Plan your benchmark by defining what you want to test. This gives you a structured list of test cases to work through.
frameprobe measures the time between a mouse click and the pixels changing on your screen.
Hardware, firmware and CLI tools are open source.
03 / Hardware
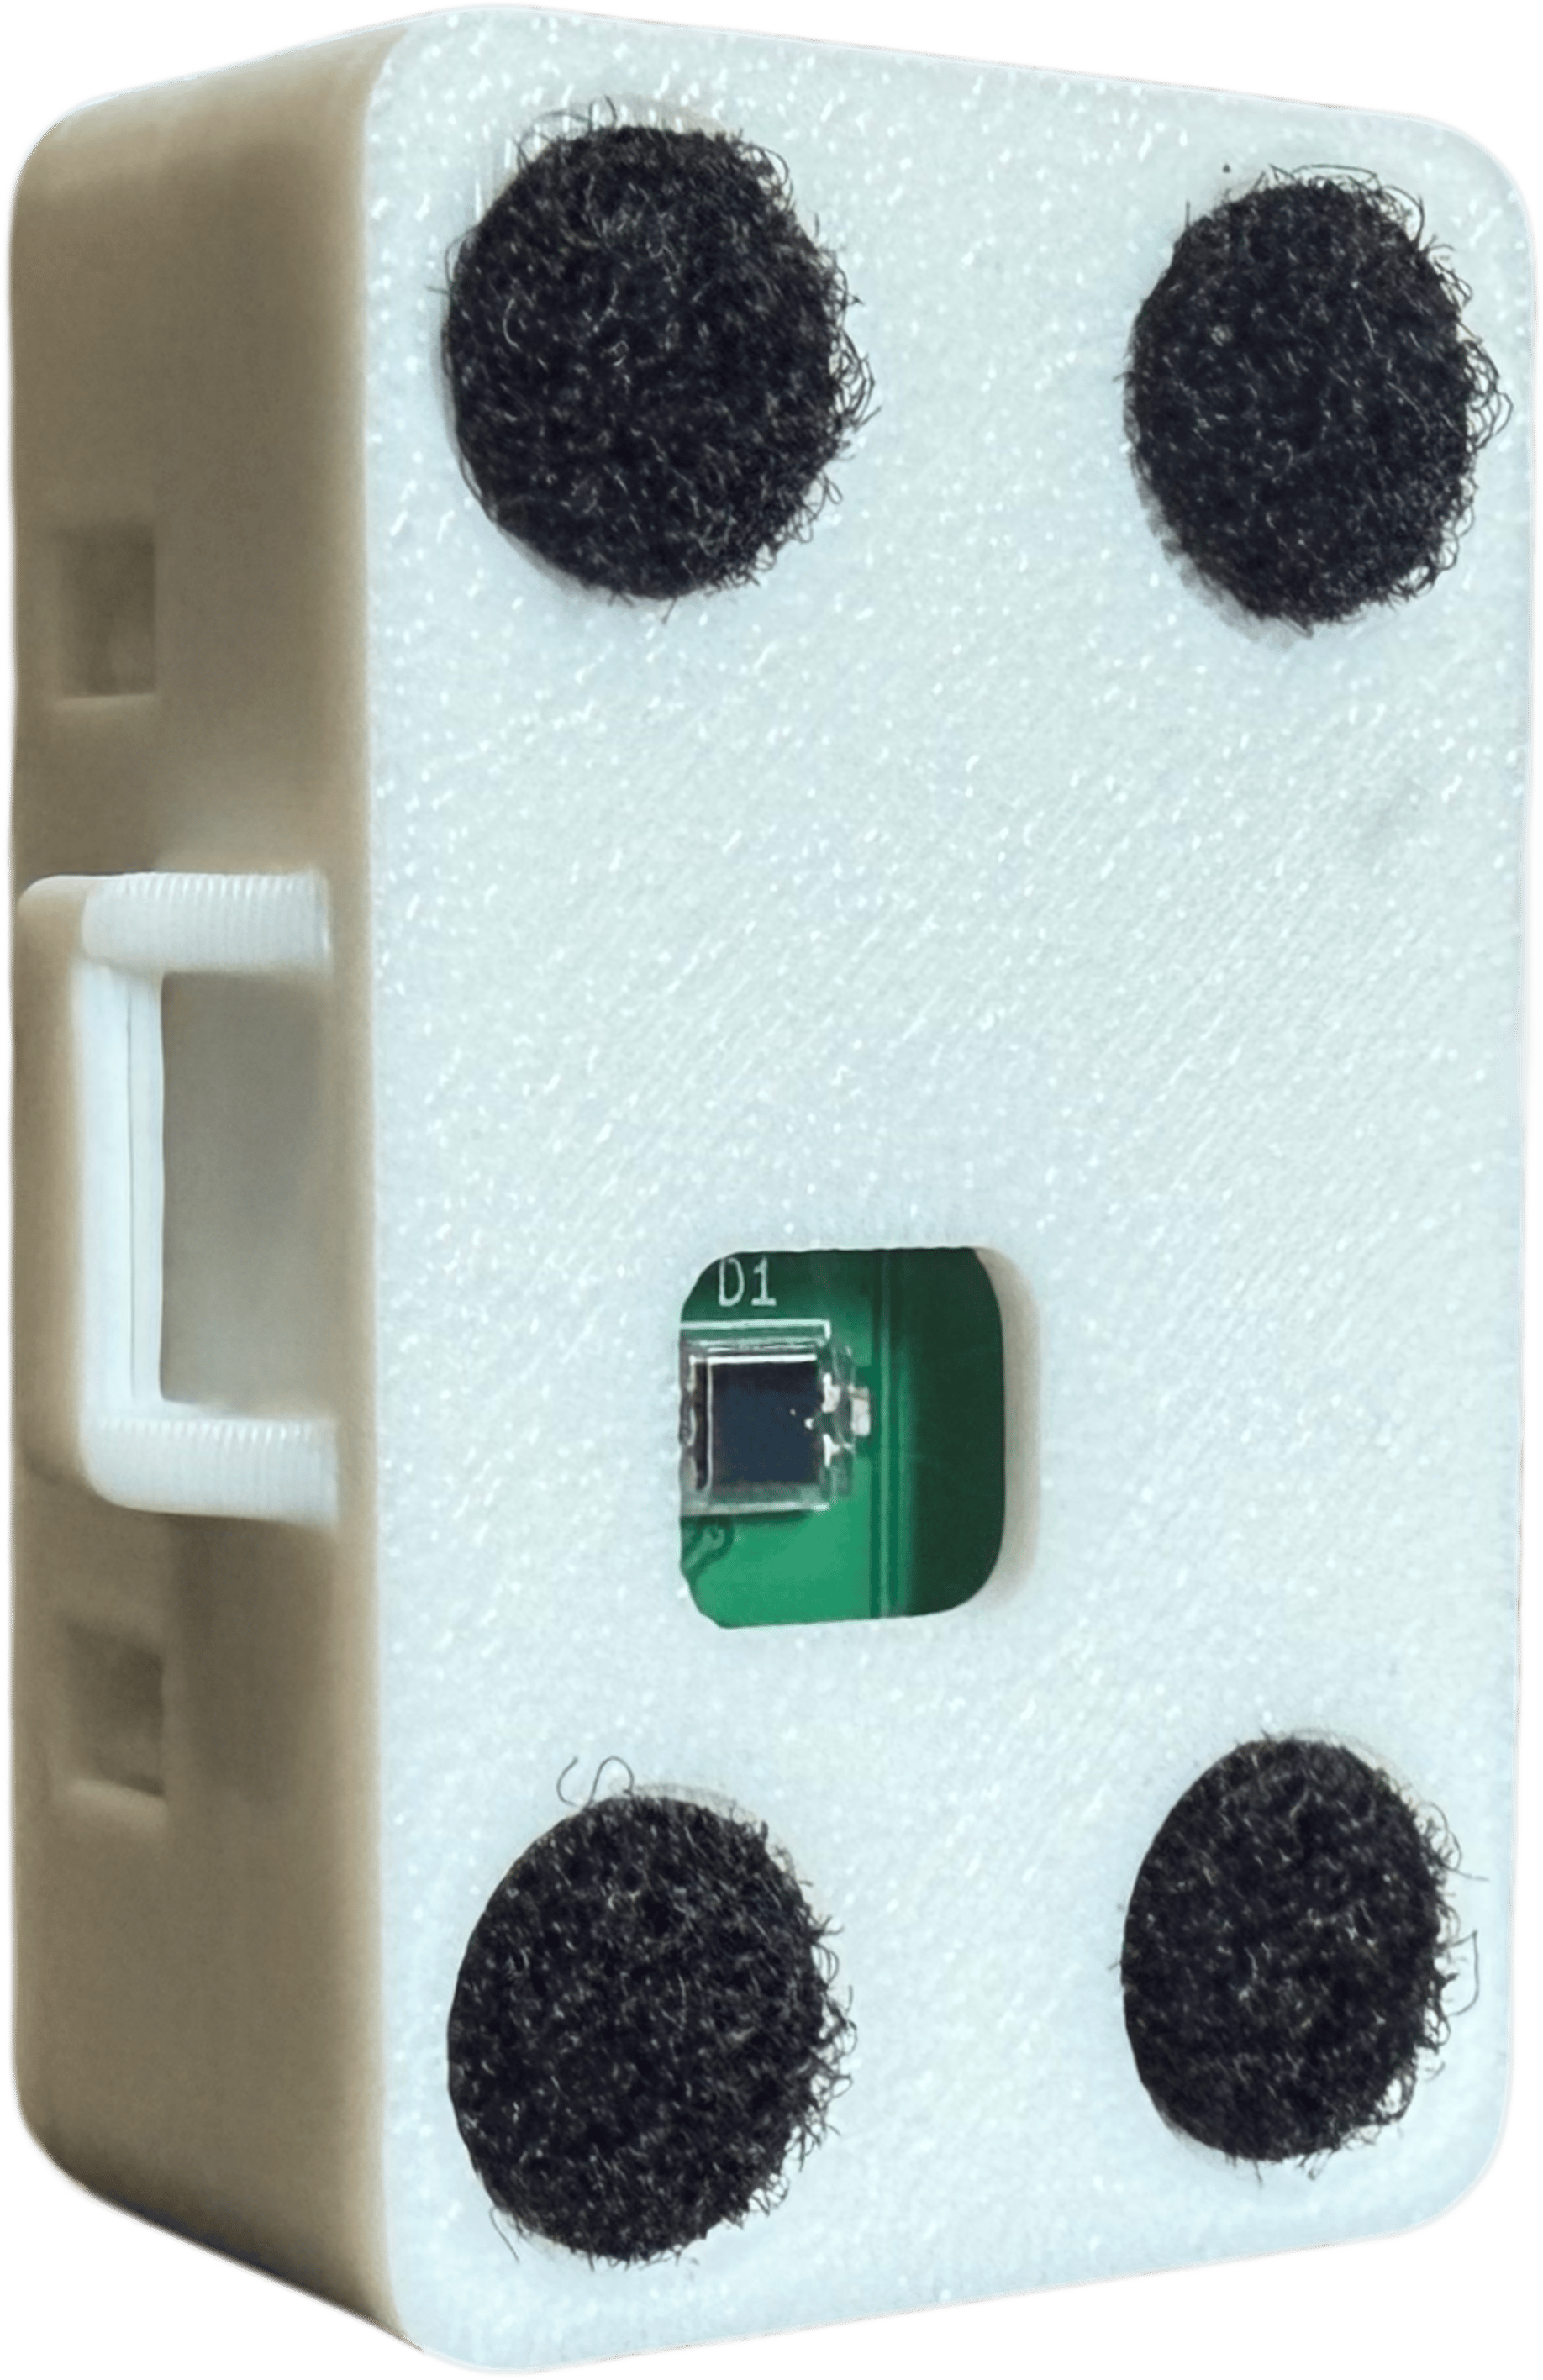
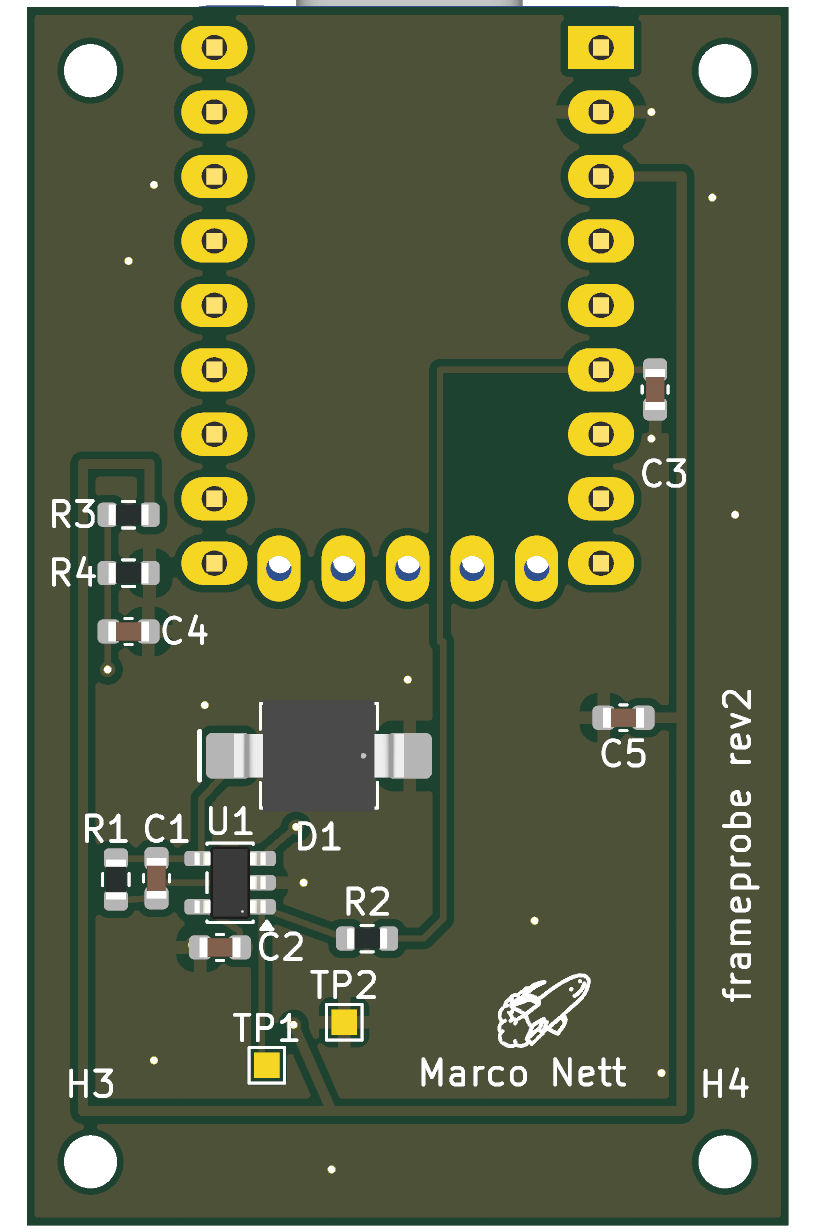
The schematics, PCB design, firmware, printable enclosure, capture tools, and analyzer are available on GitHub. Build the device yourself, inspect how it measures, or change it.
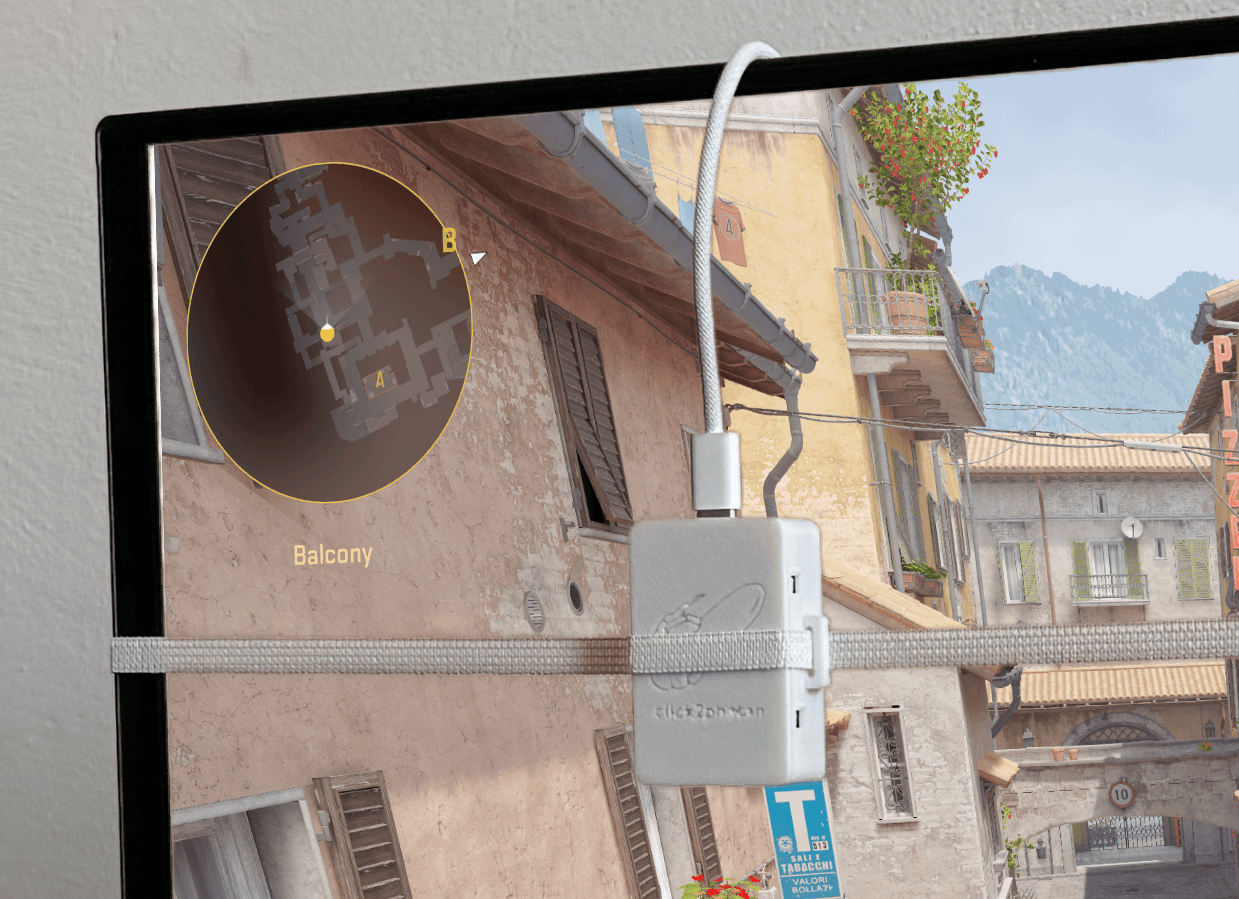
Firmware features
01 / Software
The desktop app guides you through a benchmarking workflow and renders graphs of the results. It runs on Linux, macOS, and Windows.
01 / Plan
Plan your benchmark by defining what you want to test. This gives you a structured list of test cases to work through.
02 / Measure
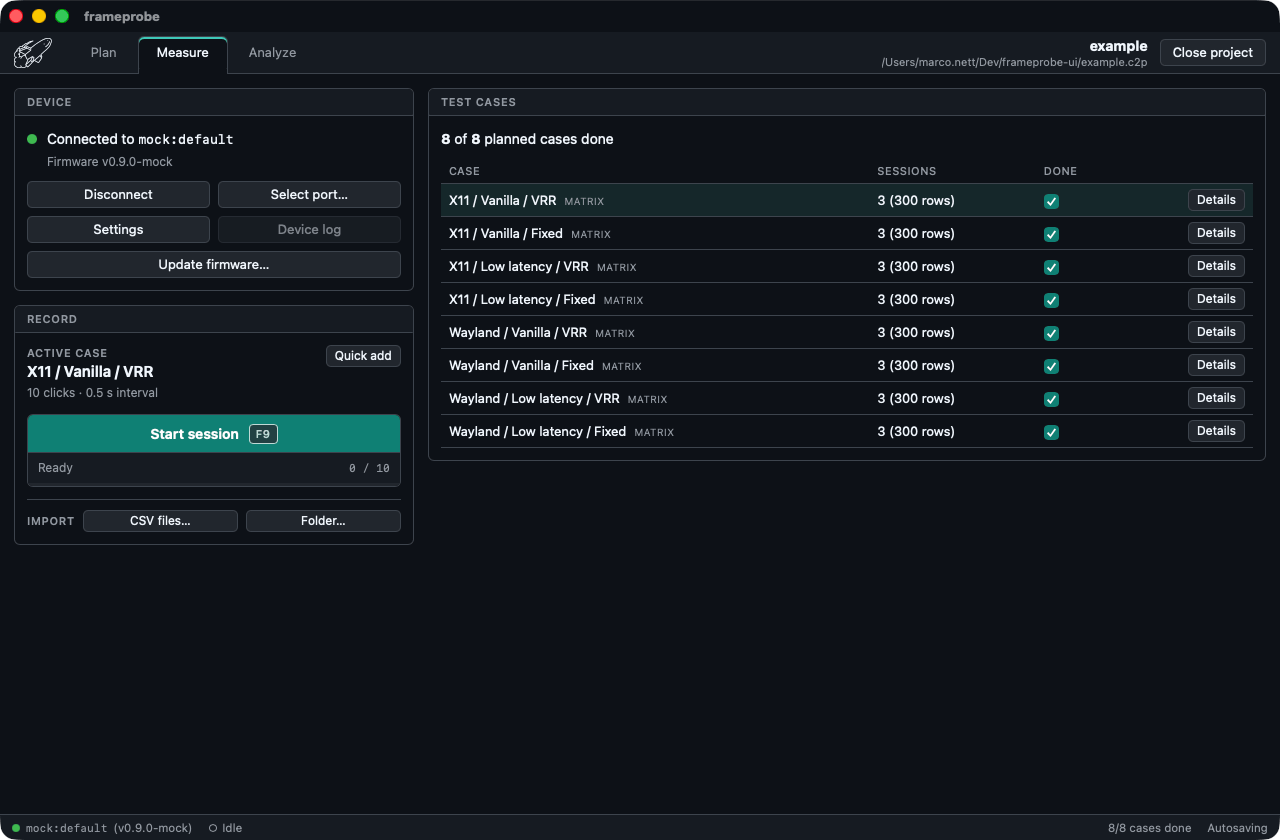
Connect the USB device, set up your testing environment, choose a test case, and start. The app also supports running quick measurements, adding notes to test cases and importing test results from the command line tool.
03 / Analyze
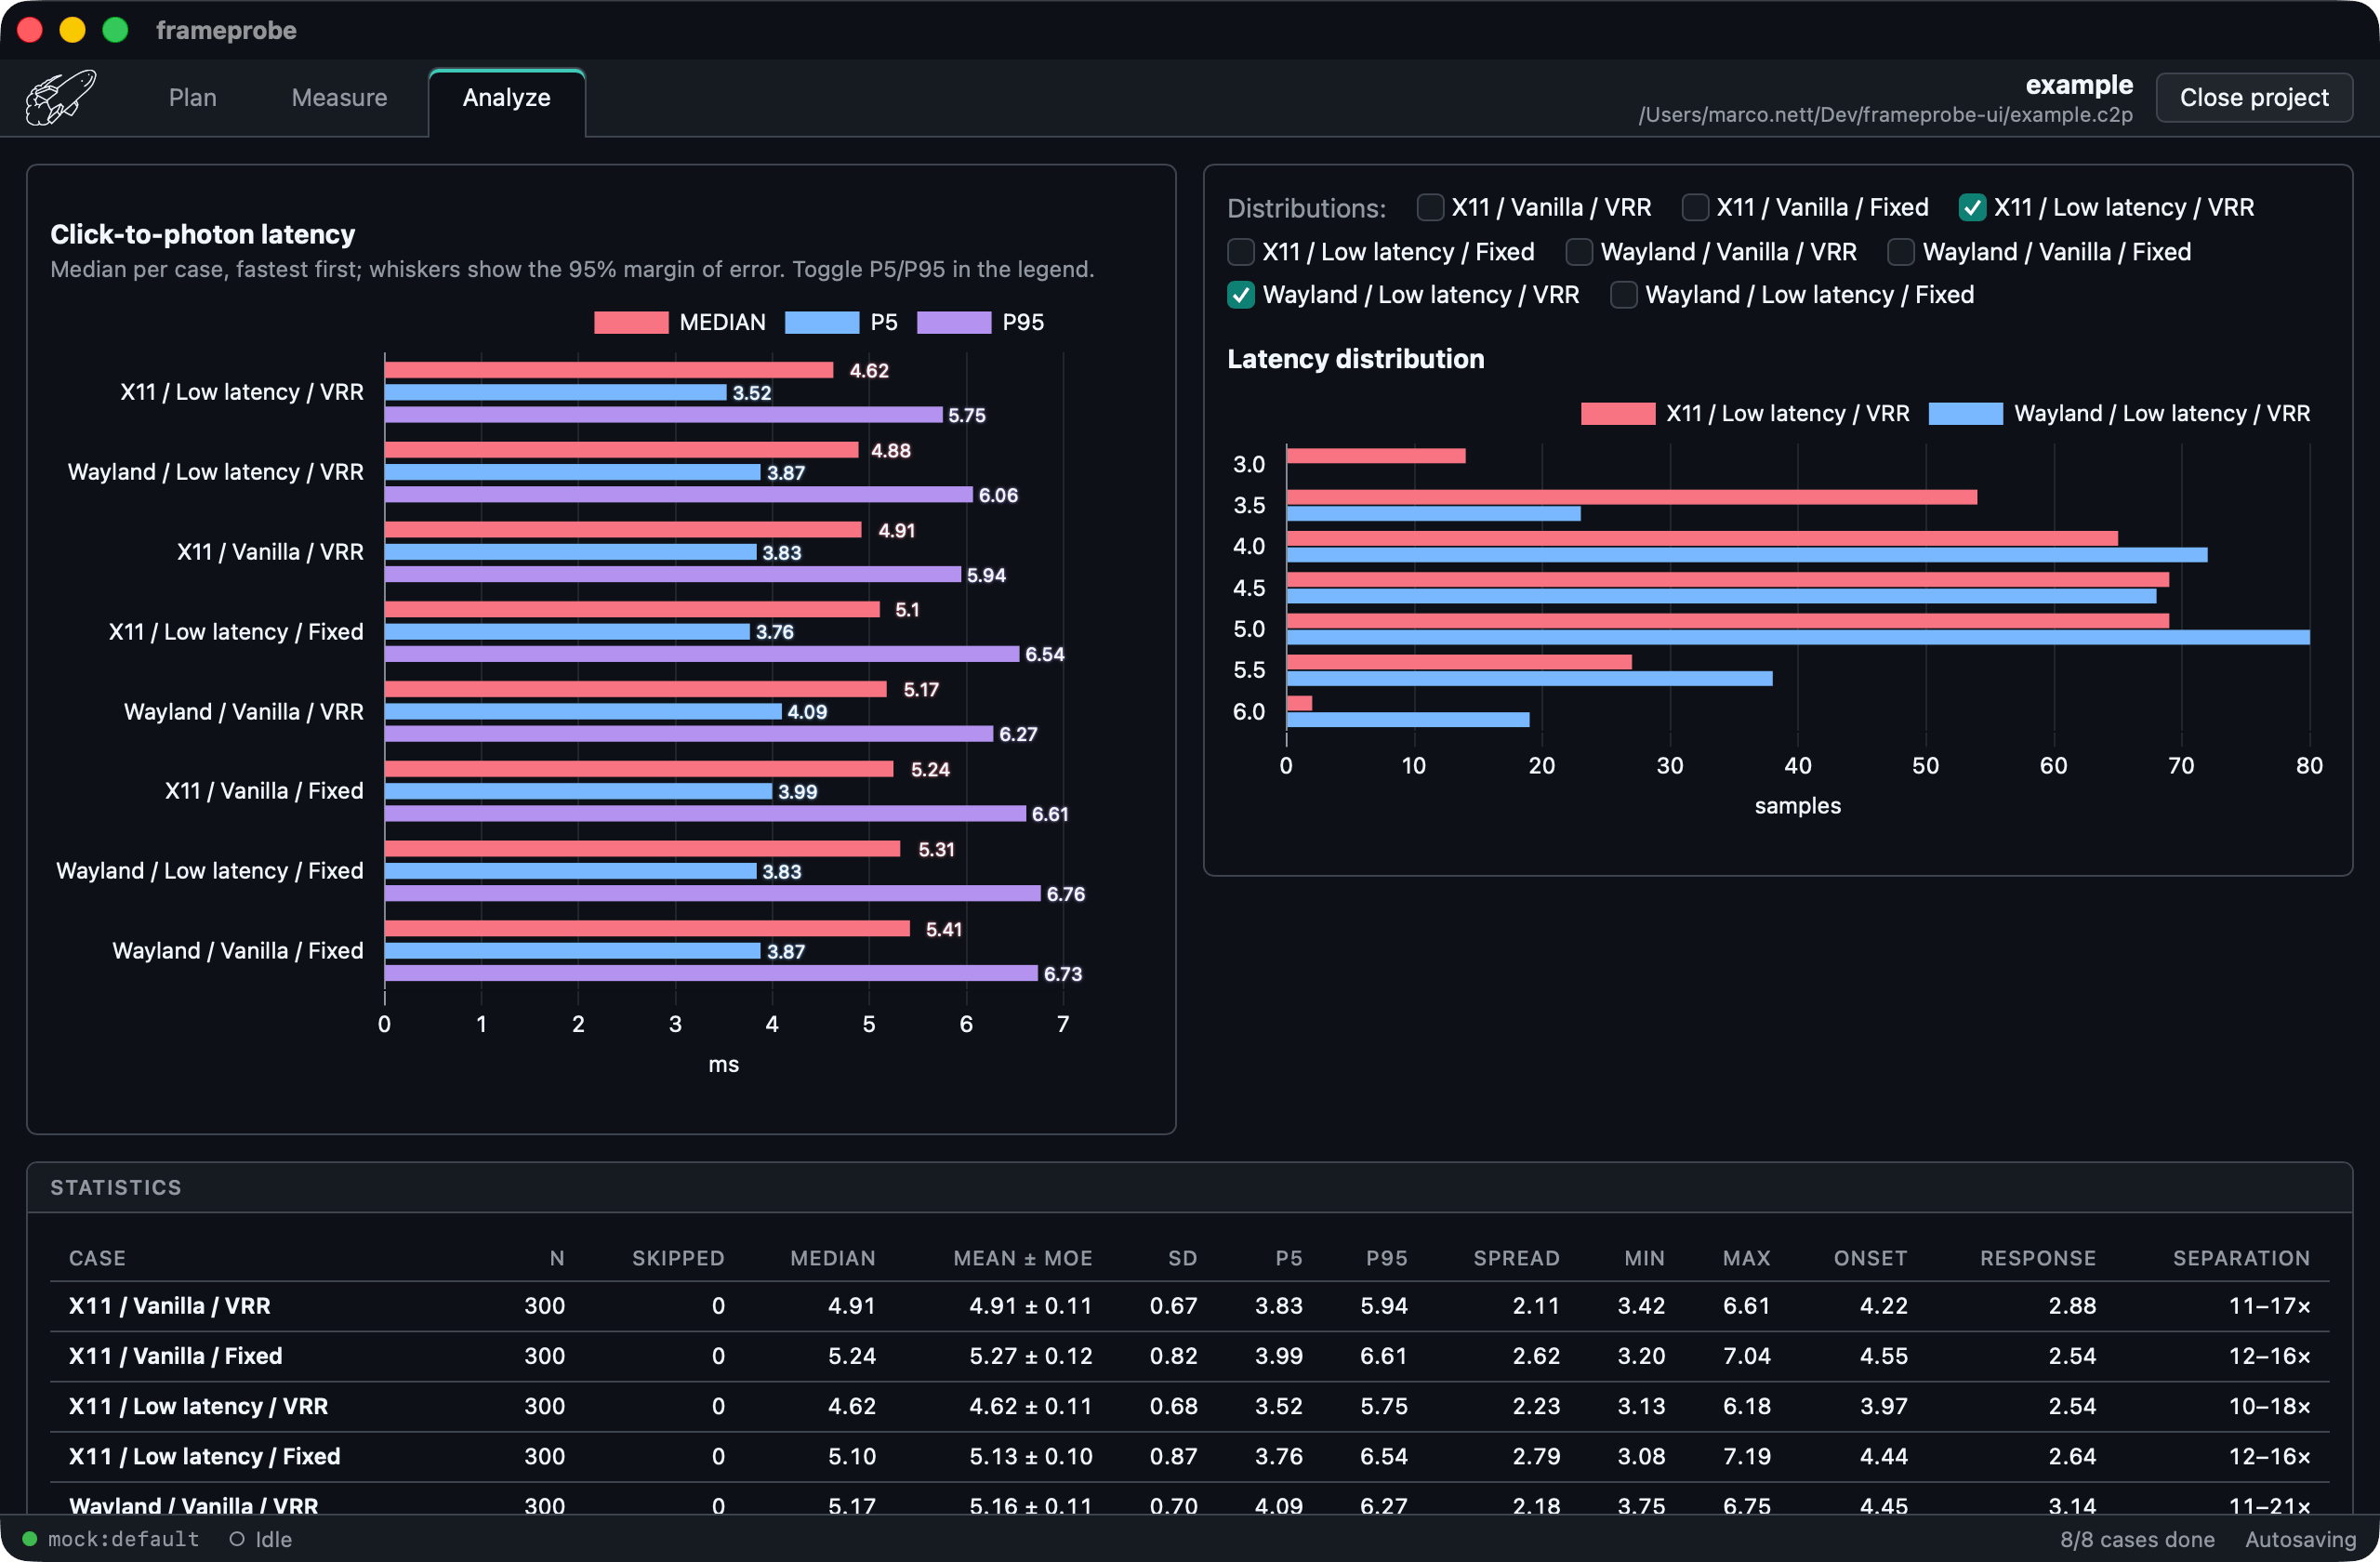
Sort cases by median latency, compare the range from P5 to P95, view the distribution of all readings, or inspect the statistics table.
04 / Headless
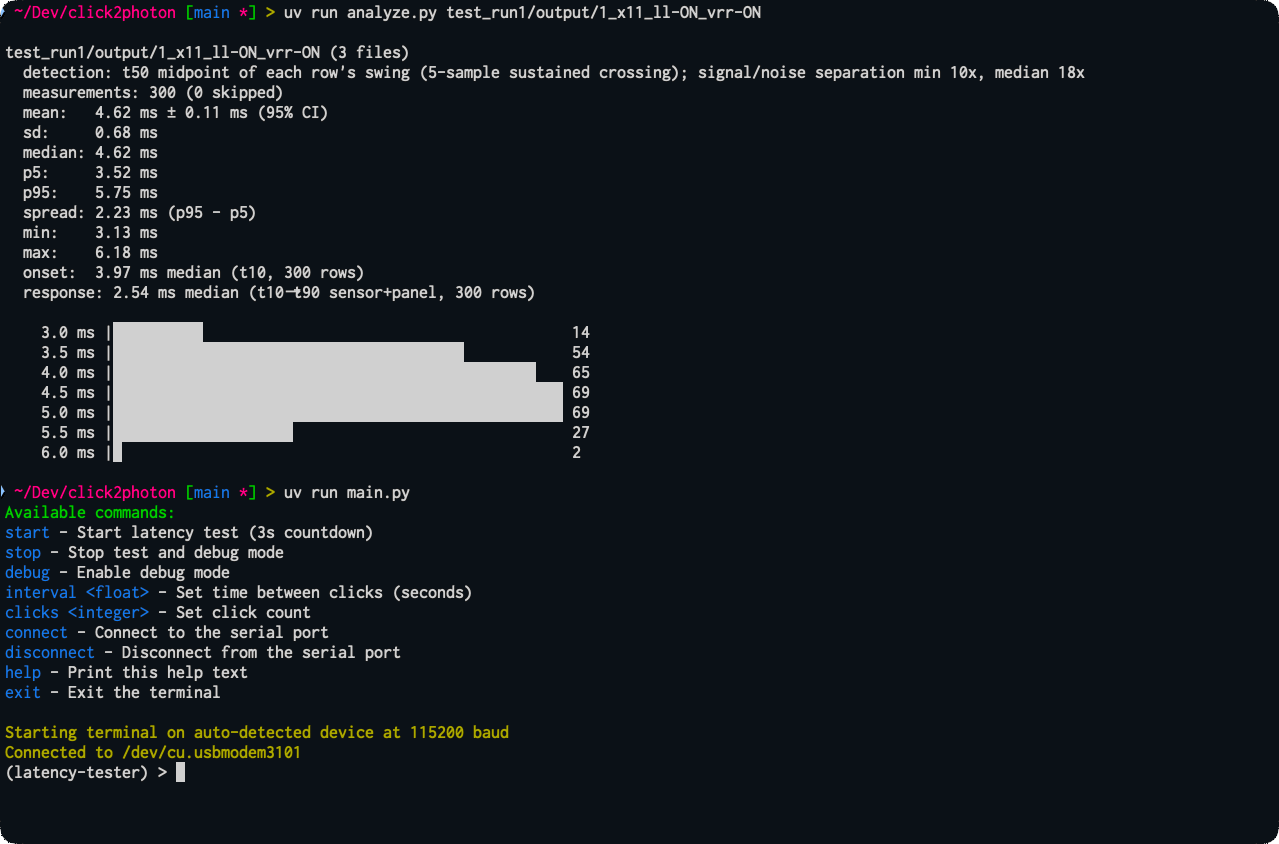
Start tests on a remote system from the command line. Analyze from the CLI. Headless results can be imported into the desktop app for further analysis.
04 / Interest
I am trying to gauge interest before I commit to a production run. If you would buy one, and want to hear from me when you can, leave your email address below. Your email address will only ever be used to contact you about frameprobe.
Interested but don't want to leave your email address? You can still just click the button, I will get notified.